Interpreting and constructing simple pictograms, tally charts, block diagrams and simple tables

To achieve this goal your child needs to understand the data gathered by them, or presented by given diagrams.

Make it

Pictogram

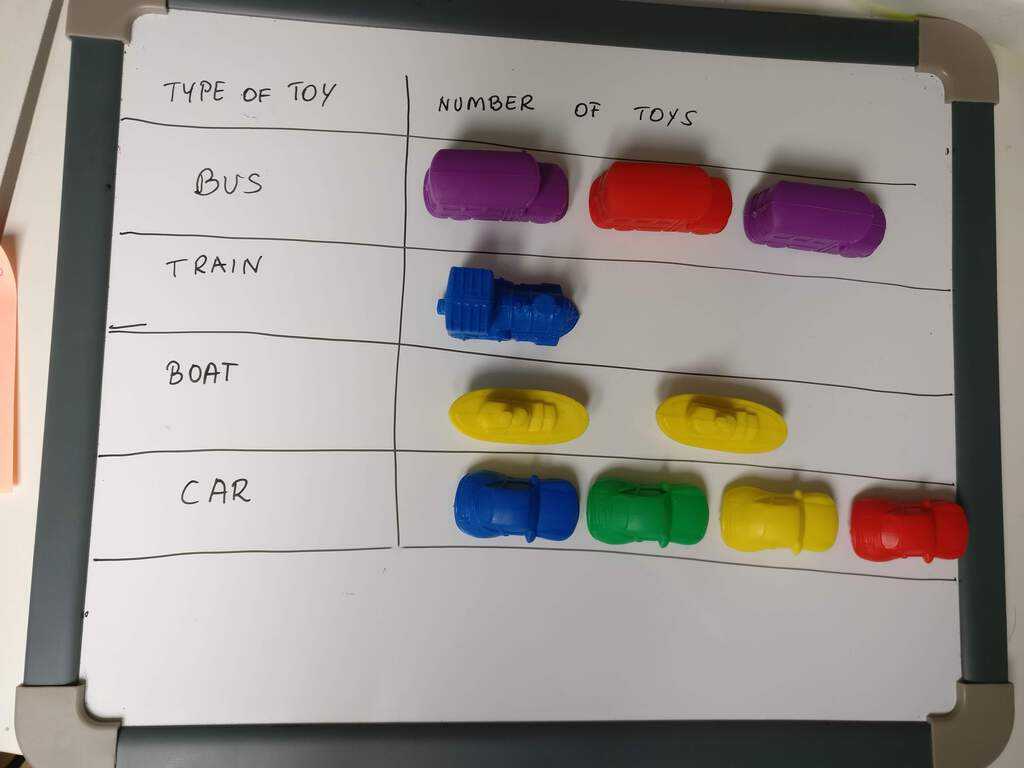
pictograms

Pictograms - use pictures to display information. Draw simple chart and use little counters or picture to display your information.

Tally Chart

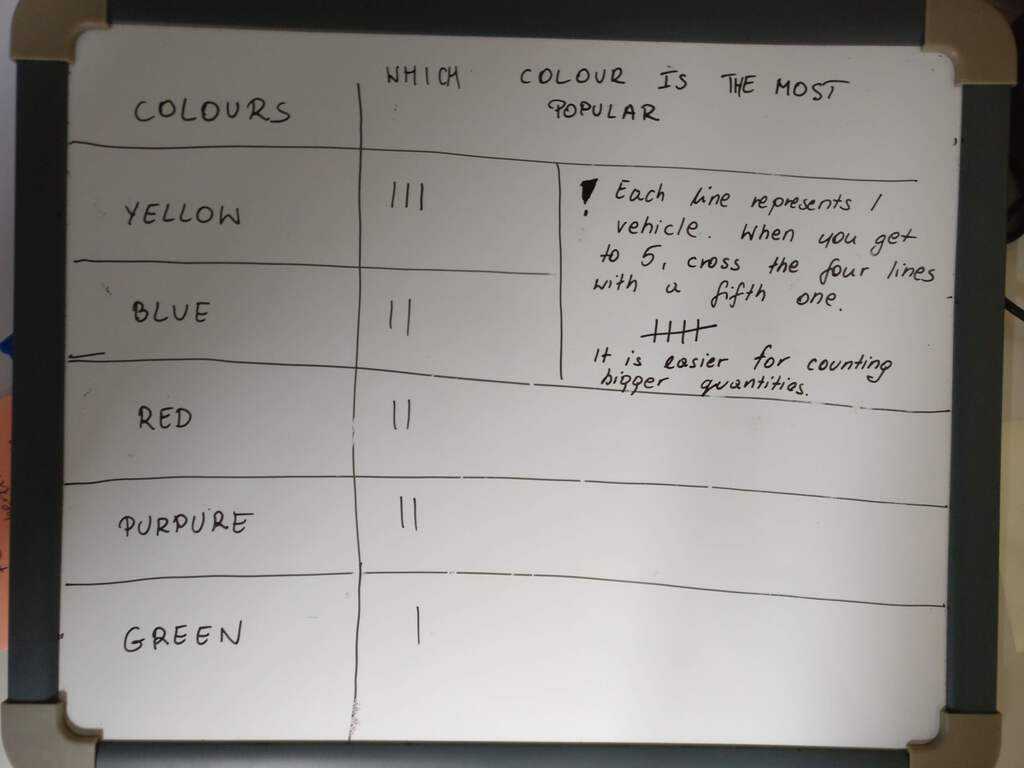
tally chart

Tally charts - lines represent numbers. Each line represent 1 item. When you get to 5, cross the four lines with a fifth one. It is really easy and you can do it on the go. Just bring a chalk with you.

Block Diagram

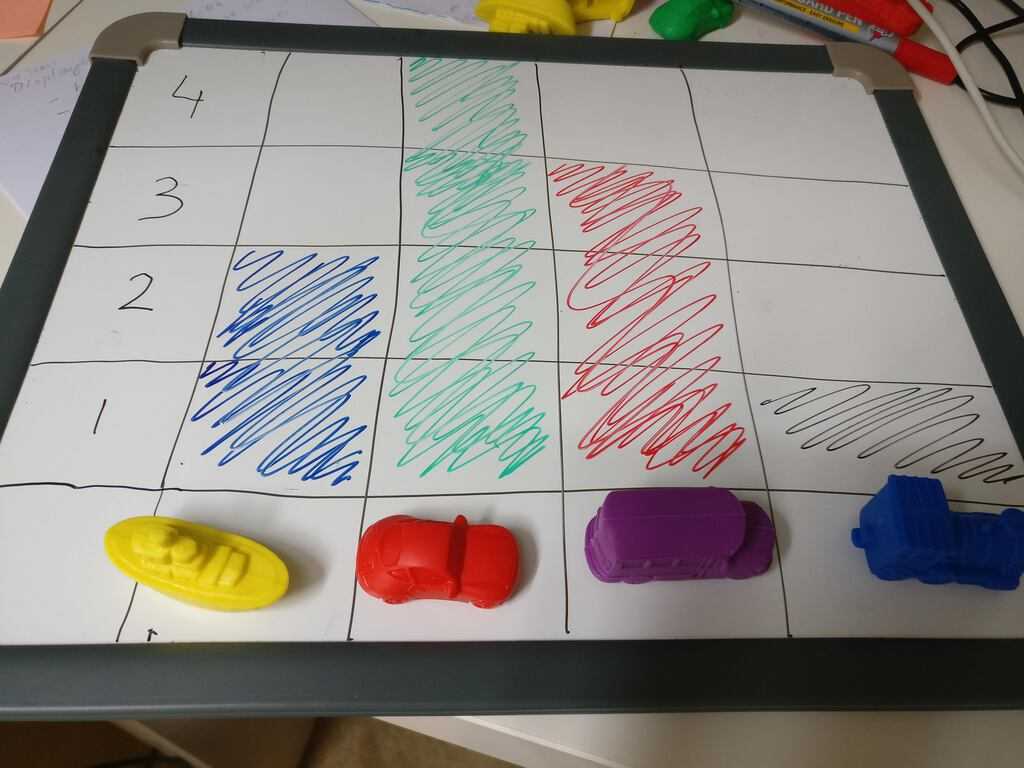
block diagram

Block diagrams - use blocks to display information.

Carroll Diagram

Carroll diagram

Carroll diagrams - allow you to group items according to their properties. It is build in yes/no fashion.

Venn Diagram

We looked at the type of faces 3D shapes have: flat or curved. The shapes that have both- were placed in the middle. Venn diagram is brilliant for looking at things that the items have in common.

Organise the resources

resources

Put selection of your favourite resources on a table. Ask your child if we can organize them somehow and count them. Next, think together, what is the best way to record the finding? Which resources do I like the most? Why won't you ask your child to organise his Hot Wheels or LOL dolls?

Buy it

BrainBox Maths

diagrams

You have it already, right?

If not, click here to view it on amazon

Click on the picture to view it on amazon.
Subscribe for updates

We will send you an email only when there is new, relevant content available. 100% no SPAM guarantee!